Project Spotlight
Malayalam Movie Data Scraper & Analyzer
A full-stack data pipeline that scrapes Malayalam movie data from IMDb, stores it in MySQL, and visualizes insights using Power BI. Designed to uncover trends in ratings, votes, and runtime in malayalam movie.
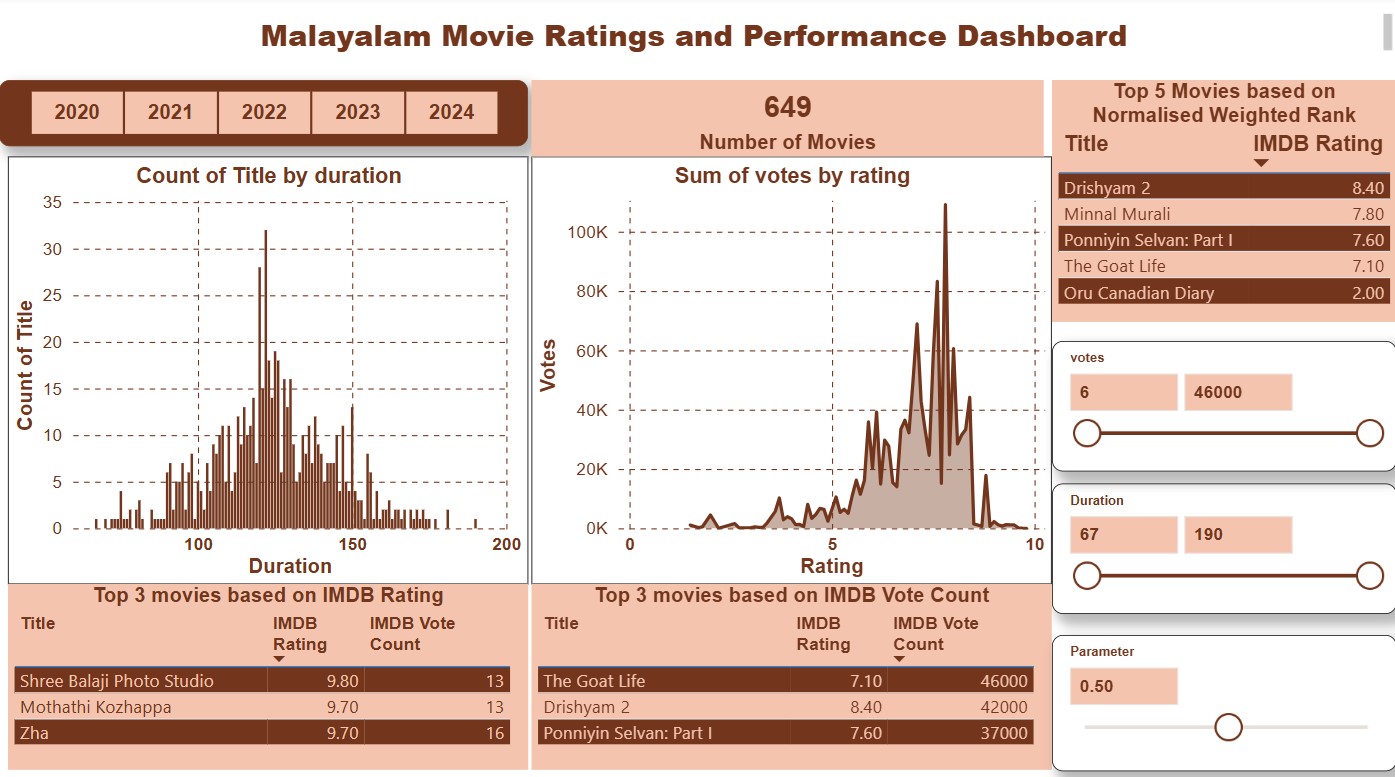
Power BI dashboard with dynamic weighting of votes and ratings
🔍 Key Features
- Scrapy Spider to extract movie metadata from IMDb
- MySQL Storage for structured data persistence
- Power BI Dashboard with dynamic sliders and normalized weighted ratings
- DAX Calculations for vote-weighted ranking logic
🧩 Problem Statement
- IMDb ratings alone can mislead rankings because some films have very high ratings but very few votes, which causes simple averages to overvalue low-sample titles.
- This results in unstable “top movies” lists across years and genres, reducing trust in recommendations and making comparisons unreliable.
🛠️ Methodology
- Scrape Malayalam movie metadata from IMDb with Scrapy and store it in MySQL for repeatable analysis.
- Create a Power BI What-If parameter (slider) to control the weight between votes and ratings during analysis.
- Use a DAX measure that combines normalized votes and normalized ratings, driven by the slider value.
- Apply a minimum vote threshold and compare raw vs weighted results to confirm stability and interpretability.
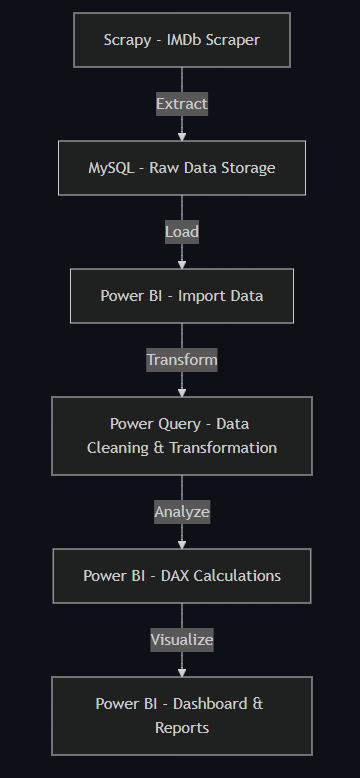
⚙️ Data flow
From raw IMDb data to interactive Power BI insights:
📐 Normalized Weighted Rating Formula
To balance IMDb ratings and vote counts, the following DAX formula is used:
Normalised Weighted Rating =
Parameter[Parameter Value] * DIVIDE(SUM('imdb movies'[votes]), CALCULATE(MAX('imdb movies'[votes]), ALL('imdb movies')), 0) +
(Parameter[Parameter Value] - 1) * DIVIDE(SUM('imdb movies'[rating]), CALCULATE(MAX('imdb movies'[rating]), ALL('imdb movies')), 0)
This formula allows users to dynamically adjust the influence of votes vs. ratings using a slider in Power BI.
📊 Power Query Transformation
The following M script cleans and transforms the raw movie data:
let
  Source = MySQL.Database("127.0.0.1:3306", "imdb", [ReturnSingleDatabase=true]),
  imdb_movies = Source{[Schema="imdb", Item="movies"]}[Data],
  updated_name = Table.TransformColumns(imdb_movies, {
    {"title", each Text.TrimStart(Text.AfterDelimiter(_, " "), ".")}
  }),
  cleaned_votes = Table.TransformColumns(updated_name, {
    {"votes", each Text.Replace(Text.Replace(_, "(", ""), ")", "")}
  }),
  numeric_votes = Table.TransformColumns(cleaned_votes, {
    {"votes", each
      try if Text.EndsWith(_, "K")
        then Number.From(Text.Remove(_, "K")) * 1000
        else Number.From(_)
      otherwise null,
    type number}
  }),
  duration_in_minutes = Table.TransformColumns(numeric_votes, {
    {"duration", each
      let
        hours = try Number.From(Text.BeforeDelimiter(_, "h")) otherwise 0,
        minutesText = Text.AfterDelimiter(_, "h"),
        minutes = if Text.Contains(minutesText, "m")
                  then try Number.From(Text.BeforeDelimiter(minutesText, "m")) otherwise 0
                  else 0
      in
        hours * 60 + minutes,
    type number}
  }),
  FinalTable = Table.RenameColumns(duration_in_minutes, {
    {"title", "Title"}
  })
in
  FinalTable
💡 Key insights
- Vote weighted ranking reduces volatility from low sample titles and produces consistent top N lists.
- Year and genre slices show newer films often have fewer votes; weighting prevents recency bias.
- Minimum vote thresholds plus the slider enable context specific ranking strategies.
✅ Validation
- Spot checks confirm transformed fields (votes, duration, title) match IMDb after cleaning.
- Sensitivity tests: moving the slider shifts rankings as expected between vote-led and rating-led outcomes.
- Applying a sensible minimum vote threshold stabilizes the top 10 across refreshes and filters.